Multifamily Activity Heat Map: See Which Markets Were Popular Last Month
A Dynamic Underwriting Map Drawn from redIQ Data
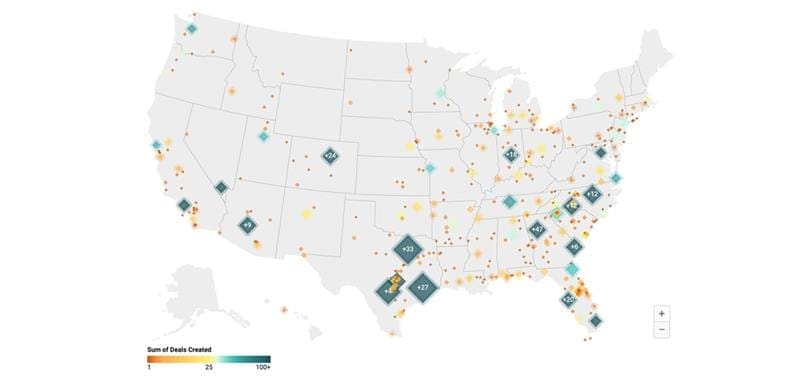
Each day, redIQ users underwrite hundreds of assets, uploading deal documents from multifamily properties in every major market. Whether a Class A deal in Austin or a mixed-use community outside Chicago, it exists in redIQ. These deals come from every kind of multifamily firms: institutional investors, large lenders, and brokers with national coverage.
For the first time, we’ve assembled the raw number of deals created in redIQ in the last 30 days by metro area data on an interactive map, providing meaningful insight into the popularity of a given market. 40% of all deals underwritten in the country pass through redIQ, making it a meaningful representation of a market’s popularity.
Get an idea of what’s happening in your preferred markets now rather than waiting for a report or assembling one yourself. Fill in your information below to unlock the continually updated map of deals underwritten every month in redIQ.
About redIQ
Since 2012, redIQ has led in the multifamily analytics and underwriting software space. Six of the top ten acquisitions teams and eight of the top ten brokerages rely on redIQ daily. Every year, more than 30% of all multifamily transactions pass through the platform. Our platform allows CRE professionals to extract and standardize data from deal financials instantaneously, gain deep insights into every property, and generate a comprehensive underwriting, with our model or their own. Our robust set of features includes floor plan summaries, cash flow analysis, hyperlocal comp sets, easy deal sharing, preset assumptions underwriting templates, and more. redIQ will always provide better insights and faster underwriting. These empower our users to make smarter investment decisions.
Unlock the Map
Fill out the form below to see the interactive map, powered by redIQ.